We recently completed an in-depth historical analysis of the United States tax collections and tax spending since 1940. The results of this analysis were alarming, to say the least. Over the past 74 years there have been significant increases in government spending and collections (taxes) on an individual basis. This upward trend illustrates a major shift in power to the US Government from US citizens.
Since 1940 there have been major changes to the US tax code which were brought about by major historical events such as; wars, societal changes, economic changes and changes in the role of government. These changes have led to major modifications in the amount of taxes collected from US citizens and the amount that the US Government spends on an annual basis. With increases in population, and inflation hitting the US dollar just about every year, it makes it difficult to compare year to year figures. By adjusting prior year receipts and spending with inflation figures, and by adjusting for population, we can make a good comparison of government collections and spending today vs. prior years.
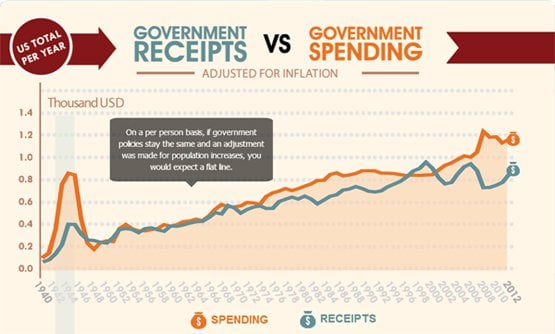
The below chart is a comparison of government spending and receipts that is adjusted for both inflation and population. The vertical axis is the inflation adjusted spending and receipts received on a per person basis and the horizontal axis is the year. If government tax policies stayed the same you would expect to see a flat line. This upward trend illustrates that the average American pays more in taxes and receives more help from the government year after year.
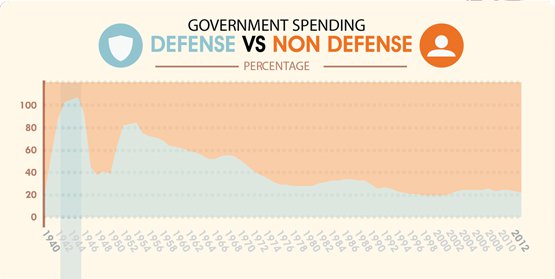
In the 1940s there was a significant spike in Government spending that can be attributed to World War II. After the war there was a significant drop in spending due to cut backs in defense spending. However, even with no world wars, the upward trend in government spending continued to rise above the average annual spending per year of $8,000 per person. The significant increase in spending on a per person basis can be attributed to increased spending on non defense related items. The graph below shows the percentages of government spend that can be attributed to defense spending and non-defense spending from 1940 to present. Following World War II, Korean War and Vietnam there was a significant shift towards non-defense spending.
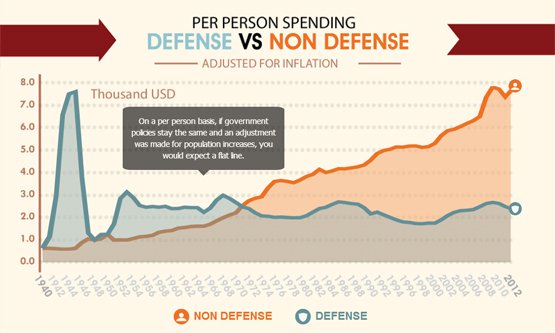
For 2013, it is predicted that the US Government will spend $7,741 per person on non defense related spending, which is up from $208 in 1940 (adjusted for inflation). The predicted spending for 2013 on a per person basis for defense will be around $2,095, which has remained fairly steady for the past 70 years (except for major war periods). The chart below shows the rising trend of non defense spending since 1940.
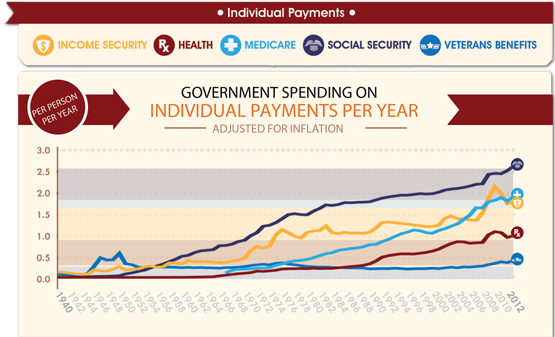
The vast majority of non-defense spending is made up of Social Security, Medicare, Health, Income Security and Veterans benefits and services. Below is an inflation adjusted chart that shows the trend of these expenses on a per person basis since 1940 (in thousands).
The above charts clearly show that over time the Government has increased its role in the average American’s life by collecting and spending more on a per person basis. Every time the Government decides to increase its spending it takes away from the individual choices of US citizens as to how and what they can spend their money on. It can be argued that since the United States has a democratic government, the citizens have voted for these tax increases, which begs the questions: Do Americans think they are voting for more benefits, which sound great coming from a politician running for office, but fail to realize that receiving those benefits will increase their taxes? How much longer can this upward trend be sustained? Will more citizens speak up and decide that they want to stop handing over more control to the Government to decide how their hard earned money is spent?
This post was published on November 20, 2013