
THERISINGTREND
70 YEAR HISTORICAL
PROGRESSION OF US
GOVERNMENT SPENDINGS
AND TAX COLLECTIONS
TREND
70 YEAR HISTORICAL
PROGRESSION OF US
GOVERNMENT SPENDINGS
AND TAX COLLECTIONS
PROGRESSION OF US
GOVERNMENT SPENDINGS
AND TAX COLLECTIONS
Over the past 70 years the United States tax code has had significant and gradual changes which can be traceable to major historical events, changes to society, economy and changes in roles of the government. These changes have led to major changes in taxes collected from citizens and the amount government spends on an annual basis.
brought to you by:

CLICK HERE
FOR SOURCES


THE
RISING
TREND
ICONOLOGY
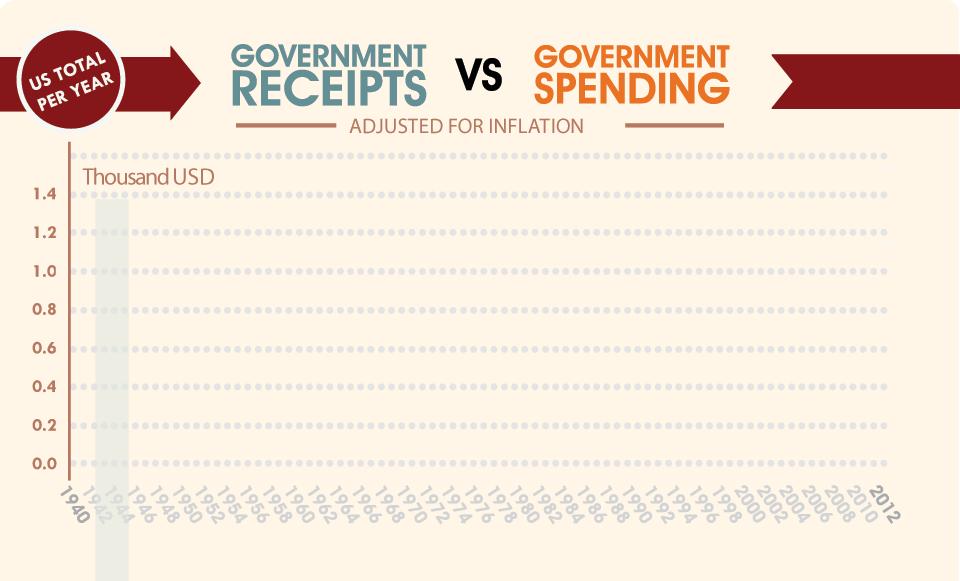
 SPENDING
 RECEIPTS
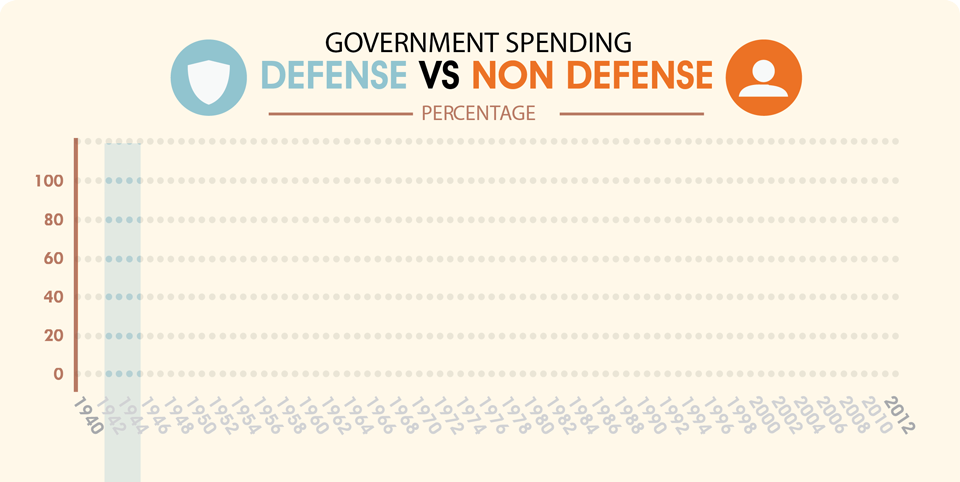
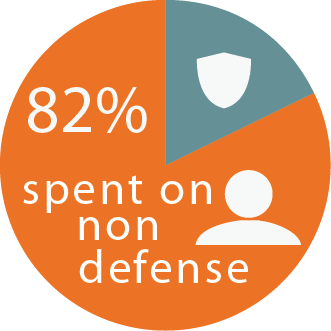
 NON DEFENSE
 DEFENSE


$157.254
BILLION
$108.756
BILLION
•1940•
POPULATION:
132 Million
*INFLATION ADJUSTED
•2013•
POPULATION:
315 Million

$3.685
TRILLION
$2.712
TRILLION
BRIEF TIMELINE OF
US TAX HISTORY
mouse over highlighted year
- 1940
- 1941
- 1942
- 1943
- 1944
- 1945
- 1946
- 1947
- 1948
- 1949
- 1950
- 1951
- 1952
- 1953
- 1954
- 1955
- 1956
- 1957
- 1958
- 1959
- 1960
- 1961
- 1962
- 1963
- 1964
- 1965
- 1966
- 1967
- 1968
- 1969
- 1970
- 1971
- 1972
- 1973
- 1974
- 1975
- 1976
- 1977
- 1978
- 1979
- 1980
- 1981
- 1982
- 1983
- 1984
- 1985
- 1986
- 1987
- 1988
- 1989
- 1990
- 1991
- 1992
- 1993
- 1994
- 1995
- 1996
- 1997
- 1998
- 1999
- 2000
- 2001
- 2002
- 2003
- 2004
- 2005
- 2006
- 2007
- 2008
- 2009
- 2010
- 2011
- 2012
- 2013


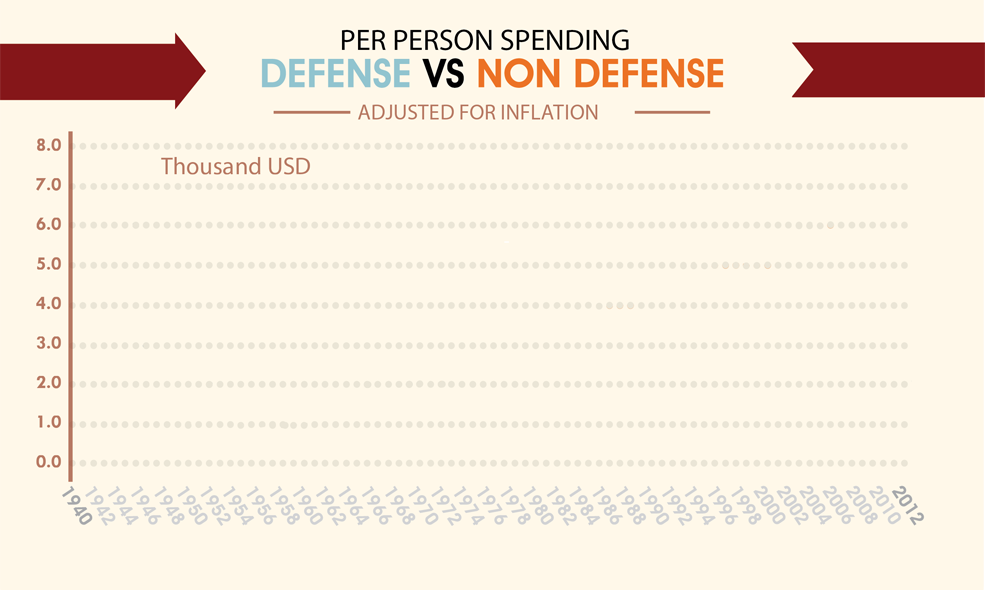
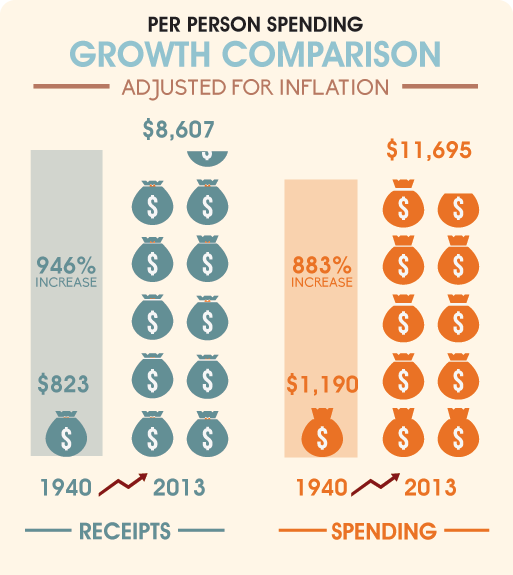
•1940•
adjusted for inflation:
$1,190
PER PERSON
$823
PER PERSON

•1943•
$7,722
per person
•1944•
$8,716
per person
•1945•
$8,559
per person
•2013•
$11,695
PER PERSON
$8,607
PER PERSON
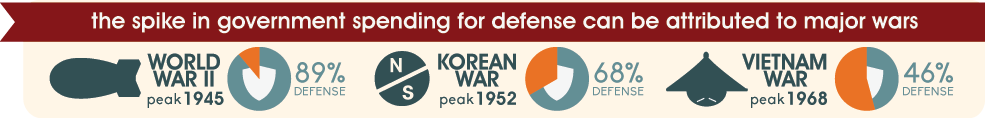
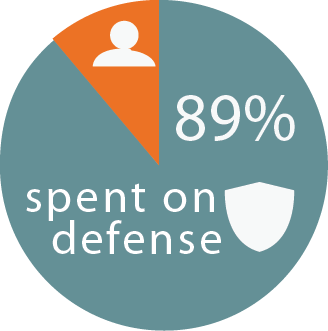
WWII
AT ITS PEAK
$1.072
TRILLION
$28.613
BILLION
adjusted for inflation
US total
$1.197
TRILLION
US total
$3.685
TRILLION
•2013•
$660.037
BILLION
$2.439
TRILLION
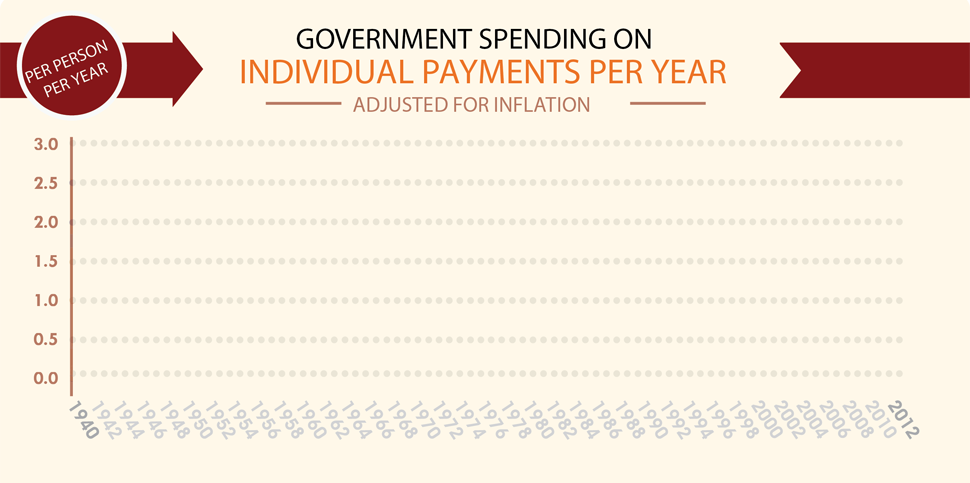
•1940•
$209
PER PERSON
$208
PER PERSON
adjusted for inflation
•2013•
$2,095
PER PERSON
$7,741
PER PERSON

$7,741
PER PERSON
current spending
•2013•
$1,751
PER PERSON
$974
PER PERSON
$1,875
PER PERSON
$2,576
PER PERSON
$398
PER PERSON
these items make up the bulk of payments for individuals
3616%
average government spending per person increase on individual payments since 1940